Adverse Event Rate Calculator
Drug Group
Placebo Group
Drug Group Metrics
Simple Incidence Rate (IR):
(Number of events ÷ Total patients)
Event Incidence Rate (EIR):
(Events ÷ Patient-years × 100)
Exposure-Adjusted Incidence Rate (EAIR):
(Patients with events ÷ Patient-years × 100)
Placebo Group Metrics
Simple Incidence Rate (IR):
(Number of events ÷ Total patients)
Event Incidence Rate (EIR):
(Events ÷ Patient-years × 100)
Exposure-Adjusted Incidence Rate (EAIR):
(Patients with events ÷ Patient-years × 100)
Risk Comparison
Relative Risk:
(Drug EAIR ÷ Placebo EAIR)
95% Confidence Interval:
(Statistical significance range)
Important: This calculator demonstrates key concepts from the article. Remember:
- Simple IR (%) can be misleading if exposure times differ
- EAIR adjusts for exposure time and patient count
- Relative Risk shows how much more likely the drug is to cause events
- Confidence intervals tell if the difference is statistically significant
- Simple IR (%) can be misleading if exposure times differ
- EAIR adjusts for exposure time and patient count
- Relative Risk shows how much more likely the drug is to cause events
- Confidence intervals tell if the difference is statistically significant
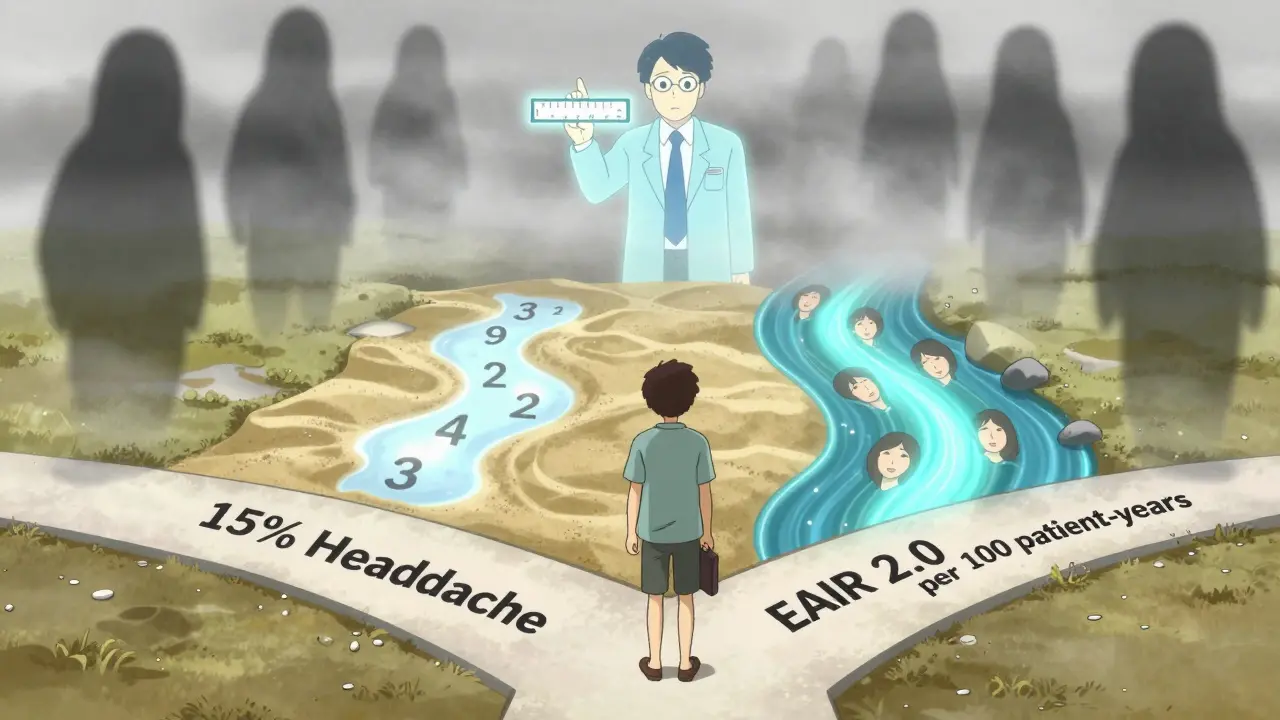
When a new drug is tested in clinical trials, regulators like the FDA don’t just look at whether it works-they need to know how safe it is. But not all safety data is created equal. Two drugs might both cause headaches in 15% of patients, but if one group took the drug for 6 months and the other for 2 years, that 15% doesn’t tell the full story. This is where adverse event rates and relative risk become critical. Understanding the difference between simple percentages and exposure-adjusted measures can mean the difference between a misleading safety profile and an accurate one.
Why Simple Percentages Can Mislead
The most common way to report adverse events is the Incidence Rate (IR): the number of people who had an event divided by the total number of people exposed. If 15 out of 100 patients got a rash, you say 15% experienced it. Simple. Clean. But here’s the problem: it ignores how long each person was actually on the drug. Imagine a trial where one group gets a new medication for 30 days, and another gets a placebo for 180 days. If 5 people in the drug group get a headache and 8 in the placebo group do, the IR says the drug causes fewer headaches. But what if the placebo group was exposed five times longer? The real risk might be the same-or even higher. That’s why the FDA started pushing back in 2023, asking companies to stop relying on IR alone in safety submissions.Enter Patient-Years: The EIR Method
To fix this, statisticians started using Event Incidence Rate adjusted by Patient-Years (EIR). Instead of counting people, you count time. One patient taking a drug for 1 year = 1 patient-year. Ten patients taking it for 3 months each = 2.5 patient-years. The formula? Total number of events divided by total patient-years of exposure. Then you multiply by 100 to get events per 100 patient-years. If 12 headaches happened across 600 patient-years of exposure, the EIR is 2.0 per 100 patient-years. This method works well when the same event happens more than once in a person-like recurring nausea or dizziness. It gives you a sense of how often the event occurs over time, not just how many people experienced it once. JMP Clinical and other regulatory-grade tools now calculate EIR automatically using treatment start and end dates (TRTSDTM and TRTEDTM). But EIR has a blind spot: it counts events, not people. If one patient gets 10 headaches, that’s 10 events. Another gets none. The EIR goes up-even though only one person is affected. That’s why regulators now prefer something even more precise.The FDA’s New Standard: Exposure-Adjusted Incidence Rate (EAIR)
In 2023, the FDA formally requested EAIR in a supplemental biologics license application. This wasn’t a suggestion-it was a requirement. EAIR doesn’t just count events or time. It counts unique patients who had an event, adjusted for how long they were exposed. EAIR = Number of patients with at least one event / Total patient-years of exposure. This removes the inflation problem of EIR. If 10 patients had a rash and they were exposed for a combined 500 patient-years, EAIR = 2.0 per 100 patient-years. It tells you: “Out of everyone on the drug, how many had the event, and how long were they on it?” MSD’s safety team found that switching to EAIR revealed hidden safety signals in 12% of their chronic therapy programs. In one case, a drug looked safe by IR because most patients dropped out early. But EAIR showed that those who stayed on long-term had a much higher rate of liver enzyme spikes. That signal would’ve been missed without exposure adjustment.
Relative Risk and Confidence Intervals: What the Numbers Really Mean
Comparing two groups? You don’t just look at their individual rates-you compare them. That’s relative risk. If Drug A has an EAIR of 3.5 per 100 patient-years and Drug B has 1.8, the relative risk is 3.5 ÷ 1.8 = 1.94. That means patients on Drug A are nearly twice as likely to experience the event per unit of exposure. But is that difference real? Or just noise? That’s where confidence intervals come in. The FDA expects statisticians to report 95% confidence intervals using the Wald method for incidence rate ratios. In R, this is done with theriskratio function. In SAS, it’s built into PROC FREQ with the RISKDIFF option.
If the confidence interval crosses 1.0, the difference isn’t statistically significant. A relative risk of 1.94 with a 95% CI of 0.98 to 3.89? That’s not enough to say Drug A is riskier. The data is too uncertain.
Competing Risks: When Death Changes the Story
Here’s a twist most people miss: if a patient dies, they can’t have another adverse event. That’s called a competing risk. In cancer trials, for example, death often happens before a slow-developing side effect like neuropathy can occur. Traditional methods like Kaplan-Meier estimators assume everyone stays at risk until the end. But if someone dies, they’re no longer at risk for the event you’re studying. Using Kaplan-Meier here overestimates the risk of that event. A 2025 study in Frontiers in Applied Mathematics and Statistics showed that using cumulative hazard ratio estimation improved accuracy by 22% in trials where competing events (like death) made up more than 15% of outcomes. The FDA hasn’t mandated this yet, but it’s being actively tested in their Sentinel Initiative with machine learning models that automatically flag these distortions.